Building a Scalable Kubernetes Monitoring Solution for Amazon EKS

Kubernetes has become the backbone of modern infrastructure. Its ability to manage containers at scale makes it indispensable for businesses seeking agility and efficiency. However, with this power comes complexity—monitoring Kubernetes clusters, especially in dynamic environments like Amazon Elastic Kubernetes Service (EKS), is no small feat.
As workloads shift, nodes scale and clusters evolve, traditional monitoring solutions struggle to keep up. Static configurations and manual interventions often lead to gaps in visibility, making it harder to ensure smooth operations and respond to issues in real time.
To address these challenges, we developed an automated, scalable monitoring pipeline tailored for Amazon EKS for one of our clients. By leveraging tools like Kube-State-Metrics, OpenTelemetry, Prometheus, and Grafana, this solution adapts dynamically to cluster changes, delivering actionable insights with minimal effort.
In this blog, we’ll explore how to build a monitoring solution that keeps pace with the demands of modern Kubernetes environments, ensuring real-time performance tracking and streamlined operations. Whether you’re managing a single cluster or a multi-cluster setup, this guide will help you navigate the complexities of EKS monitoring.
The Need for a Dynamic Monitoring Solution
Kubernetes environments are highly dynamic, with nodes scaling in and out frequently. Traditional monitoring setups often fall short because they:
- Struggle to handle constantly changing configurations.
- Require manual updates, which lead to delays in capturing real-time data.
- Fail to provide consistent visibility across multiple clusters.
For our client, these limitations were a roadblock to operational efficiency. They needed real-time insights into their clusters without the overhead of manual configurations.
Challenges in Monitoring Amazon EKS Clusters
Here are the key challenges we faced while building the solution:
Dynamic Nodes: EKS worker nodes scale automatically, making static configurations ineffective.
Multi-Cluster Setup: Seamlessly integrating multiple clusters into a single monitoring solution was essential.
Secure Access: Components needed secure and efficient access to AWS and Kubernetes resources.
Real-Time Adaptability: Changes in cluster topology had to be reflected immediately in the monitoring setup.
Tool Integration: Ensuring compatibility and coordination between OpenTelemetry, Prometheus, and Grafana.
The Solution: Automating Kubernetes Monitoring
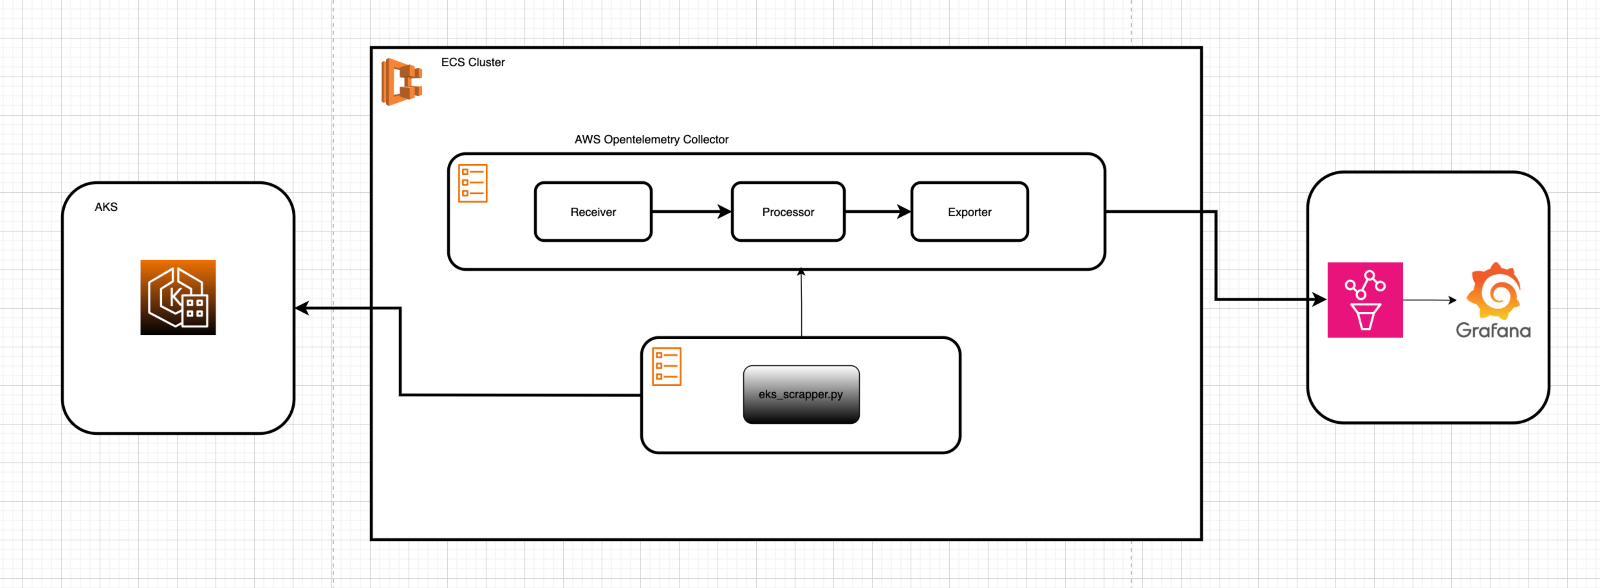
To address these challenges, we implemented a fully automated monitoring pipeline. The architecture consisted of:
Dynamic Discovery: A Python script that discovers EKS clusters, nodes, and scrape targets automatically.
Metrics Exposure: Kube-State-Metrics to expose Kubernetes resource metrics.
Metrics Scraping: OpenTelemetry dynamically scrapes metrics based on updated targets.
Storage and Visualization: Prometheus stores metrics, and Grafana visualizes them with real-time dashboards and alerts.
High-Level Workflow
EKS Cluster (Kubernetes)
↓ Expose Metrics via NodePort Python Discovery Script
↓ Update eks_targets.yaml OpenTelemetry Sidecar
↓ Scrape and Push Metrics to Prometheus Grafana
↓ Visualize and Alert on Metrics
Architecture
Technical Implementation: Building the Pipeline
Deploying Kube-State-Metrics for Metrics Exposure
Kube-State-Metrics is a Kubernetes add-on that exports metrics about Kubernetes objects in a cluster. It’s lightweight, read-only, and ideal for exposing resource state metrics.
Deployment Steps:
Install the kube-state-metrics Helm chart
helm repo add kube-state-metrics https://kubernetes.github.io/ kube-state-metrics helm install kube-state-metrics kube-state-metrics/kube-state- metrics
Expose the metrics via a NodePort service:
apiVersion: v1 kind: Service metadata:
 name: kube-state-metrics-service spec:
 type: NodePort
 ports:
- port: 8080
targetPort: 8080
nodePort: 30085
 selector:
app: kube-state-metrics
Metrics are now accessible at http://<node-ip>:30085/metrics.
1.Dynamic Discovery Using Python
To automate the discovery of clusters and scrape targets, we built a Python script that runs periodically as an Amazon ECS task.
Key Features of the Python Script
- Cluster Discovery: Uses the boto3 AWS SDK to list EKS clusters:
python
client = boto3.client('eks')
clusters = client.list_clusters()['clusters'] - Node Discovery: Retrieves node IPs from Kubernetes API and filters them based on custom tags:
def get_node_ips(cluster_name):
# Use Kubernetes client to list nodes
nodes = v1.list_node()
return [node.status.addresses[0].address for node in nodes.items]
- Target Validation: Validates metrics endpoints by sending HTTP requests:
def validate_url(url):
try:
response = urlopen(url, timeout=2)
return response.status == 200
except:
return False
4. Dynamic Target Configuration: Writes valid targets to a YAML file (eks_targets.yaml):
with open('/etc/metrics/eks_targets.yaml', 'w') as f:
yaml.dump(targets, f)
Full Script
Here’s the full implementation for reference:
import boto3 import yaml
from kubernetes import client, config from urllib.request import urlopen
def discover_metrics():
# Initialize AWS EKS client
eks_client = boto3.client('eks')
clusters = eks_client.list_clusters()['clusters']
targets = []
# Iterate over clusters
for cluster in clusters:
# Retrieve VPC and tags for filtering
cluster_info = eks_client.describe_cluster(name=cluster)
if 'PROMETHEUS_METRICS' in cluster_info['cluster'] ['tags'] and \
cluster_info['cluster']['tags'] ['PROMETHEUS_METRICS'] == 'true':
# Initialize Kubernetes client for the cluster
config.load_kube_config(cluster_name=cluster)
v1 = client.CoreV1Api()
# Discover node IPs
node_ips = get_node_ips(v1)
for ip in node_ips:
url = f"http://{ip}:30085/metrics"
if validate_url(url):
targets.append({'targets': [f"{ip}:30085"],  'labels': {'cluster_name': cluster}})
# Write targets to YAML
with open('/etc/metrics/eks_targets.yaml', 'w') as f:
yaml.dump(targets, f)
# Helper functions def get_node_ips(v1):
nodes = v1.list_node()
return [node.status.addresses[0].address for node in nodes.items]
def validate_url(url):
try:
response = urlopen(url, timeout=2)
return response.status == 200
except:
return False
2.Configuring OpenTelemetry for Metrics Scraping
OpenTelemetry acts as the scraping engine. It reads the dynamically updated eks_targets.yaml file and pushes metrics to Prometheus.
Sample OpenTelemetry Configuration
receivers:
 prometheus:
config:
scrape_configs:
- job_name: 'eks-metrics'
file_sd_configs:
- files:
- /etc/metrics/eks_targets.yaml
processors:
 batch:
exporters:
 prometheus:
Text Boxendpoint: 0.0.0.0:8888 service:
receivers: [prometheus]
processors: [batch]
exporters: [prometheus]
3.Storing and Visualizing Metrics
- Prometheus stores scraped metrics and allows advanced queries using PromQL.
- Grafana visualizes the metrics with customizable dashboards and alerts.
Overcoming Challenges
- Secure Access:
- We configured IAM roles with minimal permissions to allow secure interaction with AWS resources.
- OpenTelemetry had restricted access to the dynamically generated YAML file for scraping.
- Dynamic Updates:
- The Python script ran every 5 minutes to ensure the list of targets was always current.
- Prometheus scraping intervals were aligned with the script’s updates.
Performance Metrics
The automated pipeline provided measurable improvements:
- Discovery Latency: ~5 seconds to identify and configure new targets.
- Scraping Latency: <1 minute for Prometheus to reflect updated metrics.
- Query Latency: Grafana dashboards loaded in under 100ms for most queries.
Final Thoughts
Traditional static monitoring solutions often fall short in addressing the dynamic nature of Kubernetes, where nodes and workloads constantly scale and shift. This becomes even more critical in managed services like Amazon EKS, where real-time visibility across clusters is essential for maintaining performance, identifying issues early, and ensuring overall reliability. The solution we implemented combines automation, scalability, and integration to deliver a robust monitoring pipeline tailored for Amazon EKS. By leveraging Kube-State-Metrics, OpenTelemetry, Prometheus, and Grafana, the architecture dynamically adapts to cluster changes, eliminating blind spots and reducing manual effort. This approach not only ensures real-time insights but also simplifies complex multi-cluster monitoring, making it an ideal choice for organizations managing distributed and evolving workloads. If you’re navigating the complexities of monitoring Kubernetes environments or planning to upgrade your current setup, this approach offers a roadmap for achieving seamless performance visibility and operational excellence.