Top 10 Best Practices for Databricks Lakehouse Performance Tuning
Introduction
The Databricks Lakehouse Platform has become the backbone of modern enterprises that want to unify data engineering, analytics, and AI on a single platform. By merging the scalability of data lakes with the reliability of data warehouses, the Lakehouse enables organizations to run real-time dashboards, machine learning pipelines, and advanced analytics—all in one place.
But this flexibility comes at a cost: performance challenges. Poorly tuned environments lead to slow queries, wasted compute, and runaway bills. On the other hand, optimized Lakehouses deliver fast insights, lower costs, and smoother collaboration between data engineers, analysts, and business users.
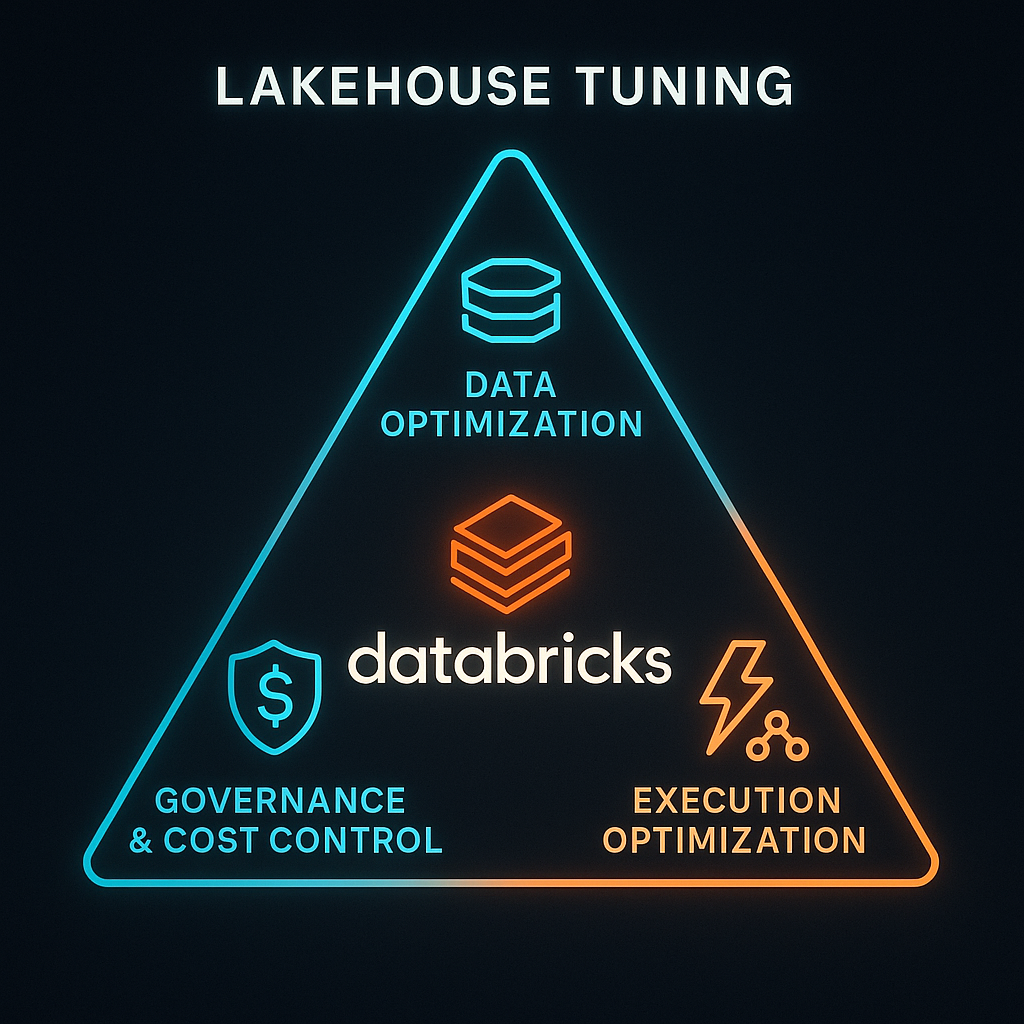
In this guide, we’ll walk through 10 best practices, grouped into three clear pillars:
- Data Optimization – How to structure and govern your data for speed.
- Execution Optimization – How to configure clusters, caching, and queries for performance.
- Governance & Cost Control – How to monitor, orchestrate, and continuously optimize costs.
Pillar 1: Data Optimization
Performance begins with how data is stored and organized. If your storage layer is inefficient, no amount of cluster tuning will fully solve performance bottlenecks.
1. Standardize on Delta Lake
Delta Lake should be the default storage layer for any critical workload. It introduces ACID transactions, schema enforcement, and time travel, while improving query efficiency.
- Convert Parquet/CSV datasets into Delta format.
- Use OPTIMIZE and ZORDER to compact small files and colocate query-heavy columns.
- Turn on Delta caching for frequently accessed datasets.
Example: A financial services firm migrated from Parquet to Delta format and used ZORDER on customer_id. Query latency for customer history dropped by 40%, enabling near real-time fraud detection dashboards.
2. Partition Strategically
Partitioning determines how much data queries scan. Done right, it reduces I/O; done poorly, it adds overhead.
- Partition on medium-cardinality columns like date or region.
- Avoid over-partitioning, which creates too many small files.
- Enable auto-optimized writes to simplify maintenance.
Example: A retail company initially partitioned sales data by hour, creating millions of tiny files. By re-partitioning to daily buckets, they reduced file counts by 95% and cut query runtime from 90s to 20s.
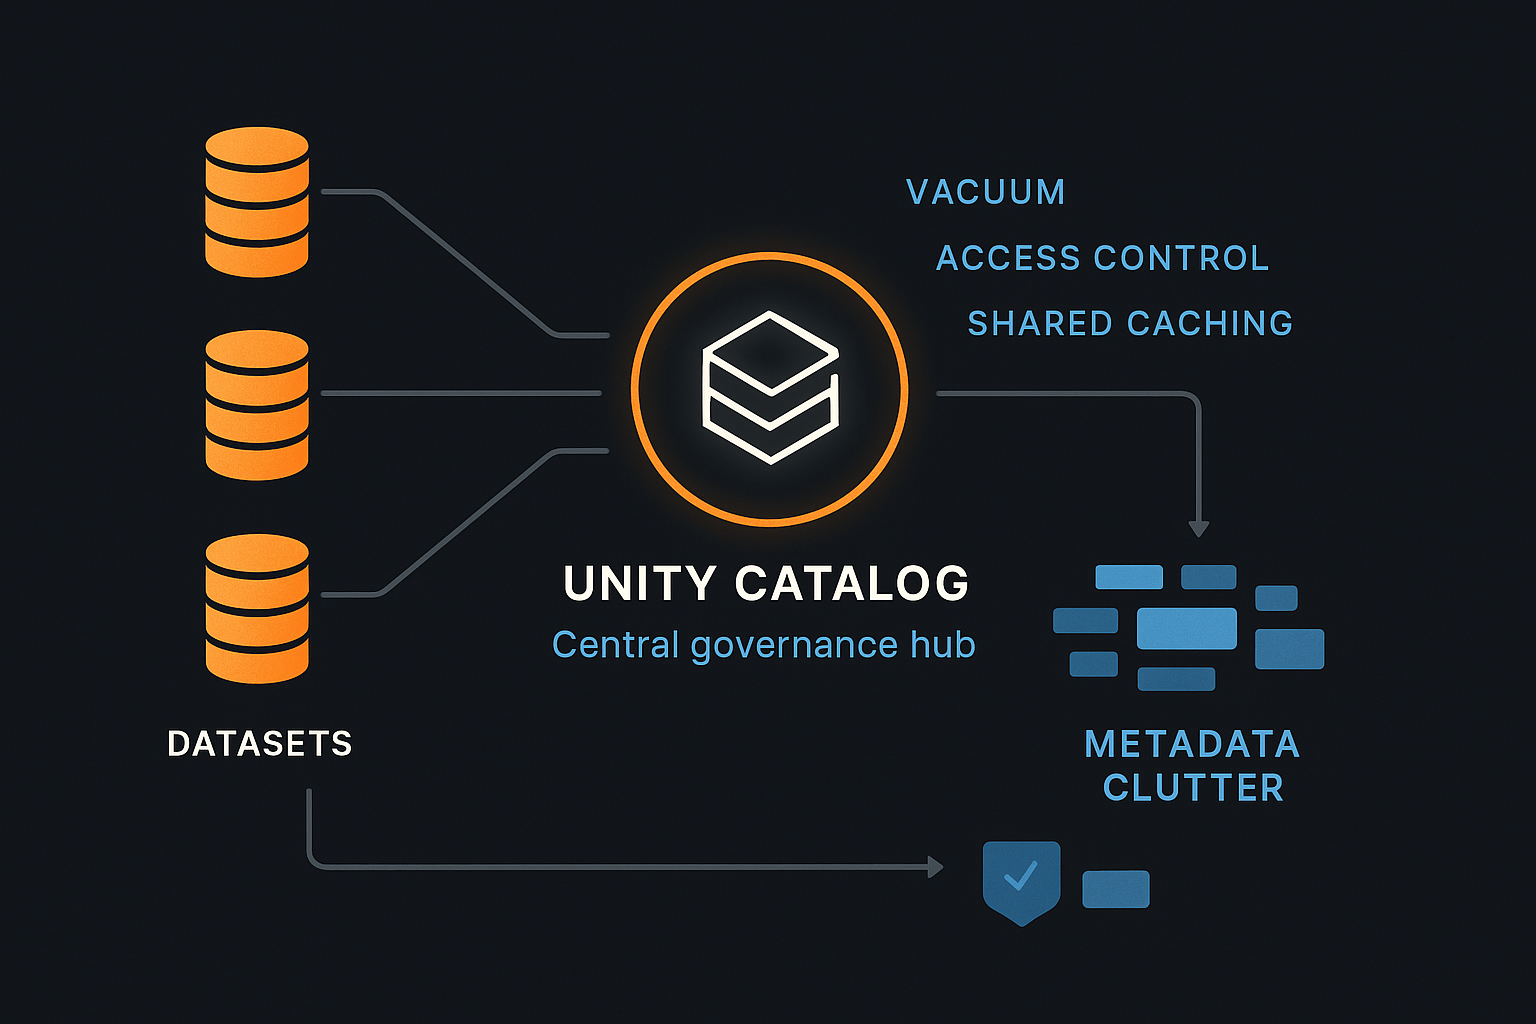
3. Manage Metadata Growth with Unity Catalog
Metadata bloat can silently drag down query planning times. Unity Catalog addresses both governance and performance.
- Centralize governance and access with Unity Catalog.
- Regularly VACUUM Delta tables to remove obsolete files.
- Avoid thousands of tiny partitions that inflate metadata overhead.
- Benefit from faster query planning and shared caching across workspaces.
Example: A global manufacturer adopted Unity Catalog and saw query planning time drop by 30%. Shared caching across workspaces boosted BI performance without extra compute.
Pillar 2: Execution Optimization
Once the data is optimized, the next step is improving how queries execute—from engines to cluster sizing to shuffle management.
4. Leverage Photon & SQL Serverless
Photon, Databricks’ vectorized query engine, drastically accelerates SQL and Delta workloads.
- Enable Photon for SQL-heavy workloads (BI dashboards, reporting).
- Use Databricks SQL Serverless for pay-per-query BI dashboards, avoiding idle cluster costs.
- Adopt materialized views or Delta Live Tables (DLT) for predictable dashboard performance.
Example: A healthcare analytics team switched their dashboards to Photon + SQL Serverless. Dashboard load times fell from 25s to 5s, transforming clinician workflows during patient rounds.
5. Cache Smartly
Caching boosts performance but should be used selectively.
- Use Delta Cache for hot tables.
- Use CACHE SELECT during iterative model development.
- Regularly review cache hit ratios to prevent wasted memory.
Example: An e-commerce platform cached product dimension tables that rarely changed. This improved recommendation model training speeds by 3x without inflating memory costs.
6. Tune Cluster Sizing & Autoscaling
Cluster misconfiguration is one of the biggest sources of wasted DBUs.
- Right-size clusters—start small, scale when needed.
- Use autoscaling clusters for elastic workloads.
- Separate clusters by workload type (ETL vs. ML vs. BI).
- Consider spot instances for non-critical workloads.
- Pick the right worker node type (compute-optimized vs. memory-optimized).
- Enable Photon only where it helps (SQL/BI workloads).
Example: A SaaS company replaced long-running all-purpose clusters with job clusters and added spot workers. The result: 25% reduction in monthly compute costs with no SLA impact.
7. Reduce Shuffle Overhead
Shuffles—data movements across nodes—are often the root cause of query slowness.
- Apply bucketing to large, frequently joined tables.
- Replace shuffle joins with broadcast joins when one table is small.
- Cross-reference: storage-level ZORDERing reduces shuffle needs later.
Example: A telco analytics workload replaced a shuffle join with a broadcast join. Query runtime dropped from 20 minutes to just 2 minutes, enabling same-day churn prediction.
8. Monitor Queries with Spark UI & Query Profile
Blind optimization doesn’t work—you need visibility into execution.
- Use Spark UI or Query Profile to inspect bottlenecks.
- Identify skewed partitions, shuffle bottlenecks, and unused scans.
- Review Ganglia metrics for idle DBU consumption.
- Use audit/event logs to monitor governance and security.
- Filter early in SQL queries to minimize shuffles.
Example: A media company noticed idle DBU consumption in their always-on cluster by reviewing Ganglia metrics. By moving workloads to job clusters, they saved $10,000 per month.
Pillar 3: Governance & Cost Efficiency
Performance is not just about speed—it’s also about sustainability and predictable costs.
9. Orchestrate Jobs Efficiently
Job orchestration ensures compute is used effectively.
- Use Databricks Workflows or Airflow for pipelines.
- Break monolithic jobs into modular DAGs, so only failed steps rerun.
- Automate retries to prevent wasted cycles.
Example: A global bank restructured a 12-hour ETL job into smaller modular workflows. With retries scoped to failed steps, total runtime dropped by 30% and wasted retries fell by 60%.
10. Monitor & Optimize Costs Continuously
Performance tuning also means reducing cloud bills.
- Track expensive queries via Cost Explorer.
- Monitor DBU consumption and idle cluster overhead.
- Adopt Liquid Clustering to reduce OPTIMIZE overhead.
- Enable result caching and metadata caching for BI queries.
- Tag workloads for chargeback and accountability.
Example: A large retailer enabled workload tagging, making departmental cloud usage transparent. This visibility cut “shadow” usage by 15%, where teams had been over-consuming compute without tracking.
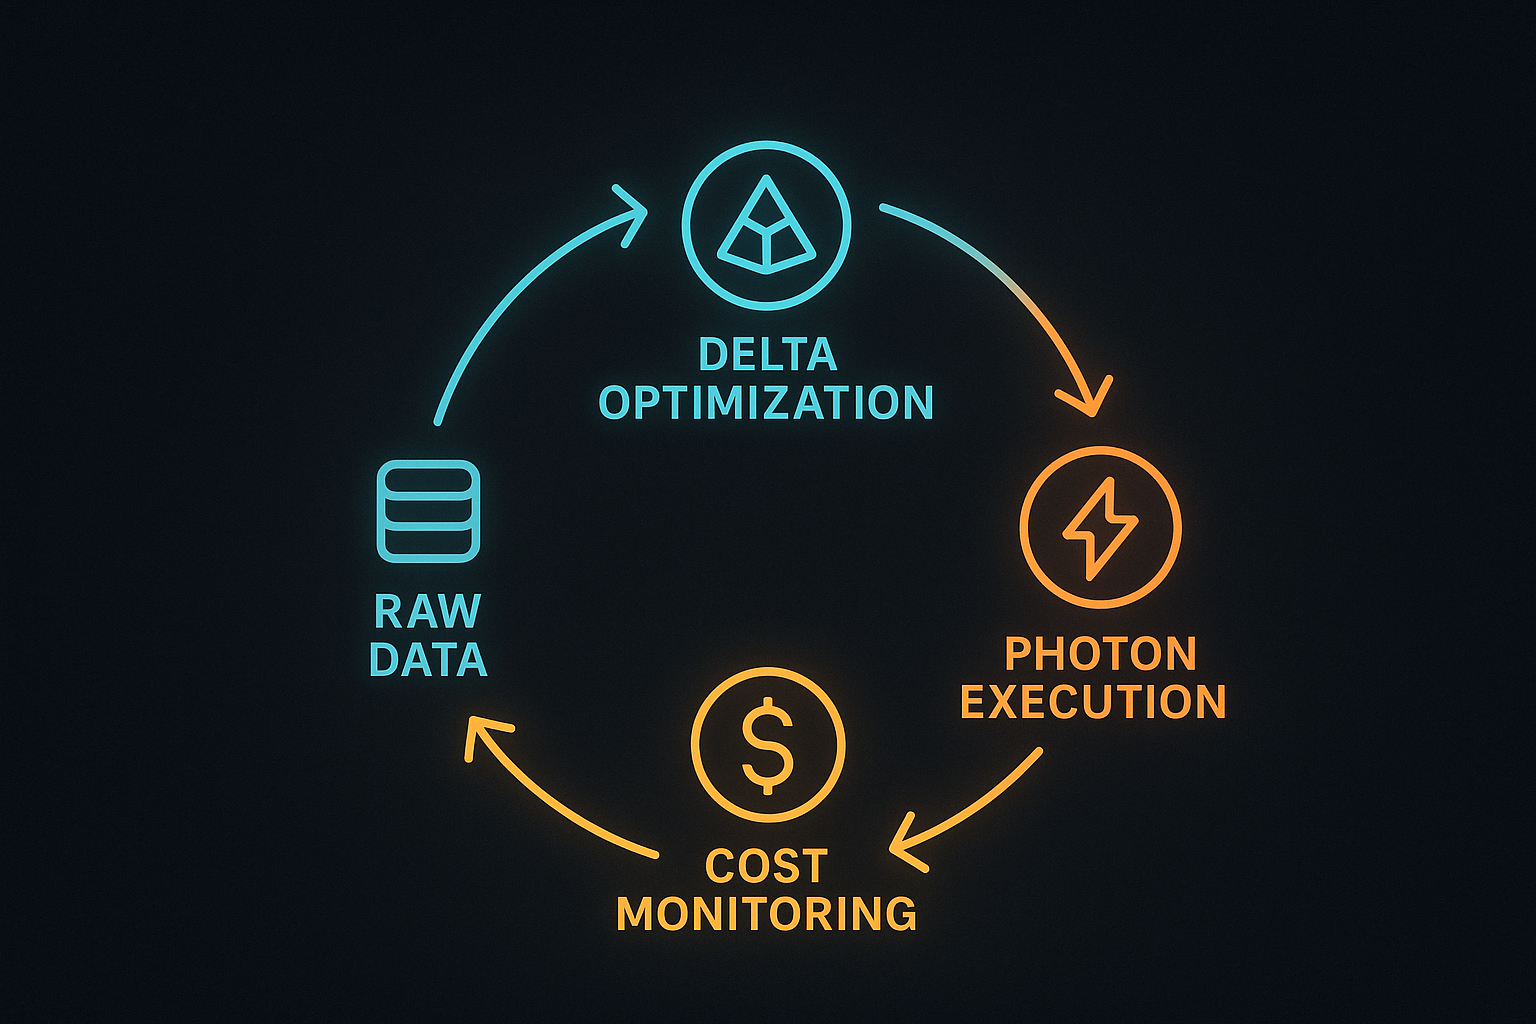
A Performance Tuning Roadmap
Think of optimization as a continuous cycle:
Raw Data → Delta Optimization → Photon Execution → Cost Monitoring
Before vs. After Improvements Table:
| Metric | Before Tuning | After Tuning | Improvement |
|---|---|---|---|
| Query runtime (avg) | 20 sec | 5 sec | 4x faster |
| Shuffle data moved | 2 TB | 500 GB | -75% |
| Monthly DBUs | 100,000 | 70,000 | -30% |
| BI dashboard latency | 25 sec | 5 sec | -80% |
| Storage costs | $20,000 | $15,000 | -25% |
Conclusion
The Databricks Lakehouse is powerful—but without tuning, slow queries, wasted resources, and cost overruns are inevitable. By focusing on the three pillars—Data Optimization, Execution Efficiency, and Governance & Cost Control—you can:
- Accelerate queries by 4x–10x.
- Reduce DBU usage by 20–30%.
- Make BI dashboards faster and more reliable.
- Keep costs transparent and predictable.
Remember: performance tuning is a journey, not a destination. As workloads evolve, so must your optimization strategy.
At Info Services, we specialize in helping enterprises design, optimize, and scale Databricks environments to achieve both performance and cost efficiency.

Faq's
1. What is Delta Lake and why use it in Databricks Lakehouse?
Delta Lake improves reliability and performance with ACID transactions, schema enforcement, time travel, and faster queries compared to Parquet or CSV formats.
2. How does partitioning improve query performance in Databricks?
Partitioning reduces the data scanned during queries. Strategic partitioning on columns like date or region improves speed and avoids excessive small file creation.
3. When should I use Photon in Databricks Lakehouse?
Photon is ideal for SQL-heavy workloads like BI dashboards and reporting. It speeds up execution significantly by leveraging vectorized query processing.
4. What causes shuffle overhead and how to reduce it?
Shuffle happens during data movement across nodes. Reduce it by using broadcast joins, bucketing, and ZORDER on frequently joined or filtered columns.
5. How do I optimize Databricks cluster costs?
Use autoscaling, right-size clusters, leverage spot instances, and monitor idle usage. Separate workloads (ETL, ML, BI) to avoid over-provisioning and reduce unnecessary DBU consumption.