How to Achieve Seamless Observability Across Clouds

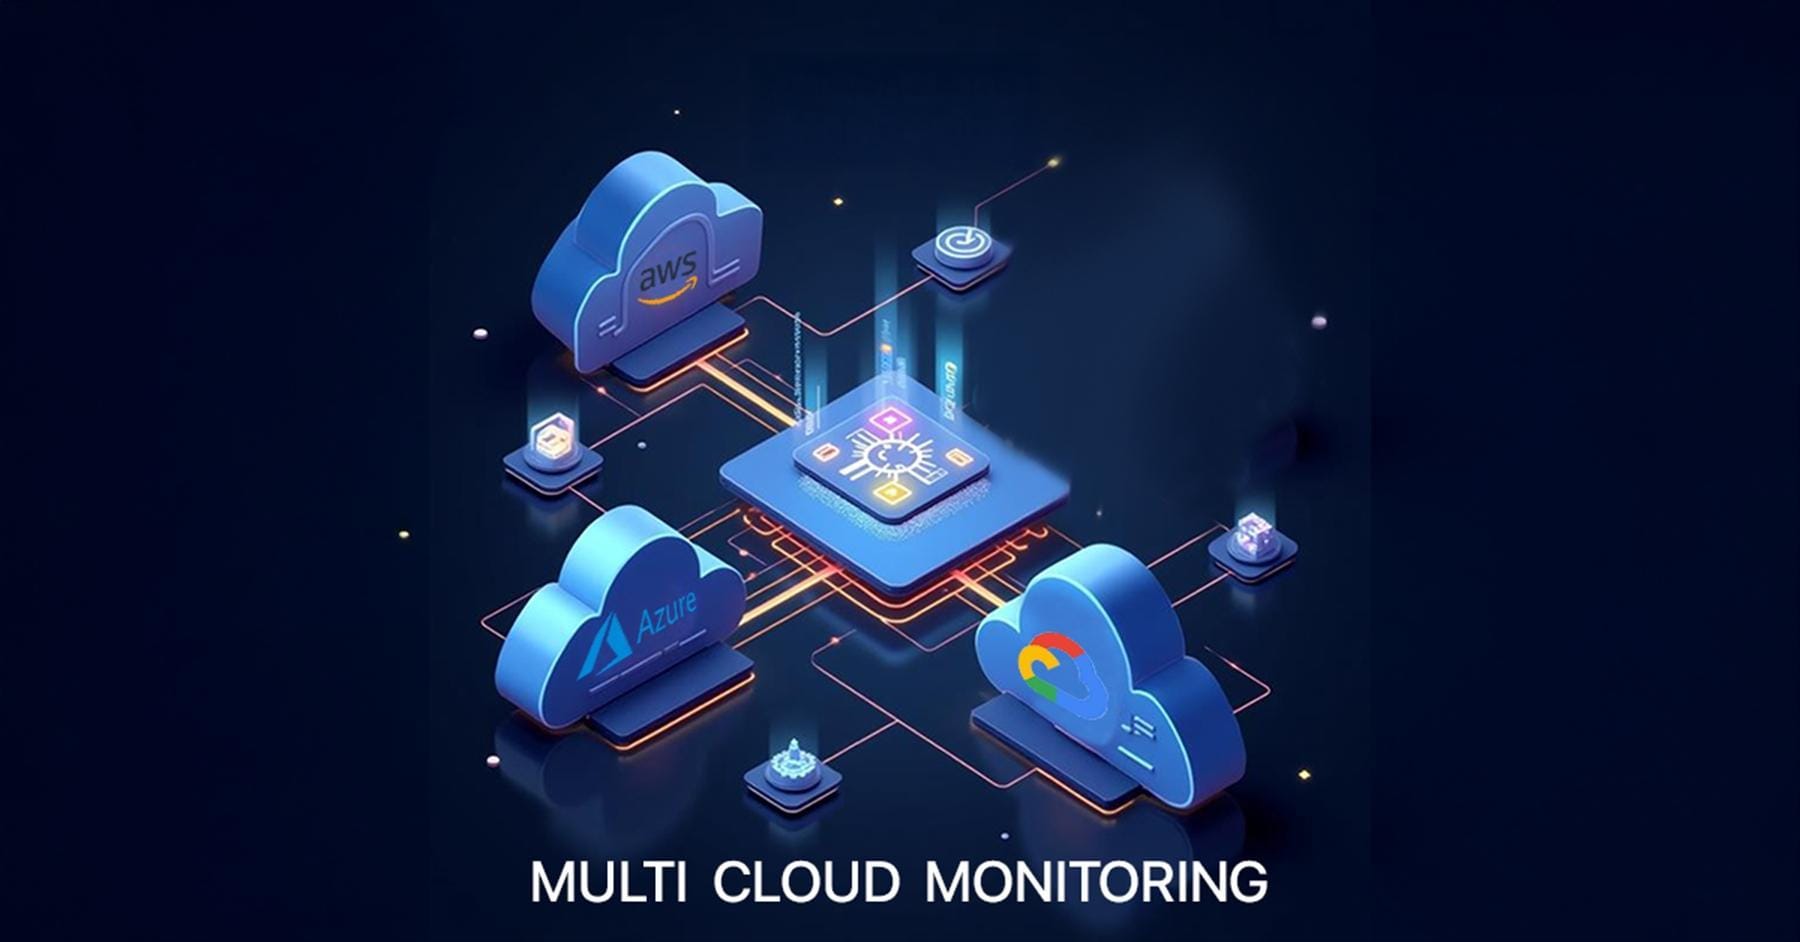
As enterprises increasingly adopt multi-cloud strategies to leverage the strengths of AWS, Azure, and GCP, maintaining observability across these diverse platforms becomes critical. Without a cohesive observability strategy, identifying performance issues and security vulnerabilities can quickly become overwhelming. According to Flexera's 2024 State of the Cloud Report, 87% of enterprises now use multiple cloud providers, underscoring the need for unified logging, monitoring, and tracing to ensure smooth operations.
This blog explores the key challenges of multi-cloud observability and outlines best practices and tools to establish a comprehensive monitoring strategy.
What is Observability?
Observability refers to the ability to measure and understand a system’s internal state based on the data it generates, specifically logs, metrics, and traces. A strong observability framework allows teams to:
- Troubleshoot issues efficiently
- Optimize system performance
- Strengthen security posture
Three Pillars of Observability
- Logging: The process of collecting and analyzing logs from applications, services, and infrastructure to identify anomalies and track events for improved system visibility.
- Monitoring (Metrics): The measurement of system health and performance through key indicators such as CPU usage, memory consumption, and request latency to ensure operational efficiency.
- Tracing: Capturing the end-to-end flow of requests across distributed systems to diagnose performance bottlenecks and identify failures effectively.
Challenges of Observability in Multi-Cloud Environments
Managing observability in a multi-cloud setup introduces several complexities, , primarily due to the fragmented nature of monitoring tools.
1. Disparate Monitoring Tools
Each cloud provider offers its own monitoring tools:
- AWS CloudWatch for AWS
- Azure Monitor for Azure
- Google Cloud Operations Suite (formerly Stackdriver) for GCP
While these tools are effective within their respective ecosystems, they struggle to communicate with each other. This creates data silos and limits the ability to get a unified view of system health.
2. Data Silos
Logs and metrics are typically stored in separate cloud-native systems, making it challenging to correlate data across platforms. This fragmentation complicates root-cause analysis and slows down incident resolution. A Gartner report estimates that over 80% of downtime is caused by misconfigurations and poor visibility, issues that are harder to resolve when data is scattered across different environments.
3. Latency and Data Transfer Costs
Cross-cloud observability solutions can introduce network latency and additional data transfer costs. Transferring logs and metrics between AWS, Azure, and GCP can increase expenses, especially for high-frequency data.
4. Security and Compliance
Moving data between cloud platforms isn’t free or fast. Transferring logs and metrics across AWS, Azure, and GCP can introduce network latency and drive-up costs, especially with high-frequency data. For example, AWS charges $0.02 per GB for inter-region data transfers, which can quickly add up when handling large volumes of observability data.
Observability Tools for Multi-Cloud Environments
Each cloud provider offers native observability tools:
- AWS CloudWatch: Provides logs, metrics, and alarms for AWS resources, with deep integration into AWS services.
- Azure Monitor: Offers end-to-end observability for Azure workloads, including logs, metrics, and application insights.
- GCP Operations Suite: Provides logging, monitoring, and tracing capabilities tailored for Google Cloud environments.
While these tools are effective within their ecosystems, they lack cross-cloud visibility.
2. Third-Party Observability Platforms
To unify observability across multiple clouds, third-party solutions offer broader capabilities:
Datadog: Full-stack monitoring platform supporting multi-cloud environments with logging, monitoring, and APM (Application Performance Monitoring).
New Relic: Provides real-time observability and performance monitoring across multiple cloud providers.
Splunk: Aggregates logs and provides security analytics and real-time data insights.
Prometheus + Grafana: Open-source monitoring stack widely used for Kubernetes and cloud-native applications.
3. OpenTelemetry for Unified Observability
OpenTelemetry is an open-source framework that enables collecting, processing, and exporting telemetry data across clouds. It supports multiple backends, including AWS CloudWatch, Azure Monitor, and GCP Logging, providing a vendor-neutral solution for instrumentation.
- 75% of cloud-native organizations now rely on OpenTelemetry for unified observability (CNCF 2024 Report).
Best Practices for Multi-Cloud Observability
A successful multi-cloud observability strategy requires a unified and consistent approach to data collection, analysis, and response:
1. Centralized Logging
Think of logs as puzzle pieces that are scattered making it hard to see the full picture. Using a log aggregation tool like ELK Stack or Splunk helps gather all logs from AWS, Azure, and GCP into one place. Centralized logging allows you to quickly spot patterns, correlate events, and resolve issues faster.
2. Unified Metrics Collection
Different clouds and different metrics make it easier to get lost in the noise. Standardizing metrics collection with tools like OpenTelemetry, Prometheus, or Grafana creates a common language across platforms. When everyone measures performance the same way, monitoring becomes simpler and more effective.
3. Distributed Tracing
Troubleshooting is difficult without tracing. Tools like Jaeger and OpenTelemetry help track the journey of requests across services and clouds, making it easier to pinpoint latency issues and service failures.
4. Automated Alerts & Dashboards
One can set up real-time dashboards and alerts using Grafana or Datadog. Configuring threshold-based alerts with severity levels can help you know which issues need immediate attention and which can wait.
5. Security and Compliance Monitoring
Security is foremost, enabling native security tools like AWS GuardDuty, Azure Security Center, and GCP Security Command Center can monitor threats and ensure compliance. Encrypting logs and telemetry data can further keep sensitive information secure and meet industry standards.
Observability Architecture for Multi-Cloud Environments
A well-structured observability architecture enables seamless data flow across cloud platforms, ensuring faster issue detection and resolution:
- Instrumentation Layer
Instrumentation forms the foundation of observability. Tools like OpenTelemetry or cloud-native SDKs generate consistent logs, metrics, and traces. CNCF reports that 84% of organizations use OpenTelemetry for telemetry data collection.
- Data Collection Layer
Agents and exporters gather logs, metrics, and traces from cloud and on-prem systems. Tools like Fluentd and Logstash can handle over 3 million events per second in high-scale setups.
- Processing & Aggregation Layer
Tools like Fluentd, Logstash, and OpenTelemetry Collector clean and structure data, improving analysis speed. Gartner estimates that proper data normalization cuts incident resolution time by up to 40%.
- Storage Layer
Centralized storage solutions like Amazon S3 (managing over 100 trillion objects), Azure Blob Storage, and Google Cloud Storage ensure secure, scalable access to telemetry data.
- Visualization & Alerting Layer
Tools like Grafana and Datadog provide real-time insights and alerts, reducing system downtime by 35% through faster root-cause analysis (IDC).
Grafana for Multi-Cloud Observability
Grafana is a popular open-source tool for real-time monitoring and visualization in multi-cloud environments.
Key Features of Grafana:
- Support for Multiple Data Sources – Integrates with Prometheus, AWS CloudWatch, Azure Monitor, GCP, and Elasticsearch.
- Flexible Dashboards – Customizable dashboards with dynamic filtering and interactive visualization.
- Alerting and Notifications – Triggers alerts based on pre-defined conditions; integrates with Slack and PagerDuty.
- Advanced Querying – SQL-like querying and data transformations for deeper insights.
- Plugins and Extensibility – Wide range of community and enterprise plugins.
Best Practices for Using Grafana:
- Organize dashboards logically to simplify navigation.
- Use variables and templates for dynamic filtering.
- Set threshold-based alerts to avoid noise.
- Connect Grafana with external ticketing systems for streamlined incident response.
Conclusion
Achieving effective observability in a multi-cloud environment requires more than just deploying monitoring tools, it demands a unified strategy for logging, monitoring, and tracing. While cloud-native tools provide valuable insights, combining them with third-party platforms and open-source frameworks like OpenTelemetry creates a cohesive observability framework. By centralizing logs, standardizing metrics, and implementing distributed tracing, enterprises can unlock deeper insights, faster troubleshooting, and more resilient multi-cloud operations.
Take Control of Your Multi-Cloud Environment, get started with us today!


