Building a MLOps Environment with AWS ML Services - Part 2

In the first part of this blog series, we explored how to build a scalable data science environment using AWS SageMaker. We discussed leveraging SageMaker's capabilities for data preparation, model training, and experimentation to create a robust foundation for machine learning workflows. However, building models is just the beginning—operationalizing these workflows at scale introduces a host of challenges that must be addressed to ensure long-term success..
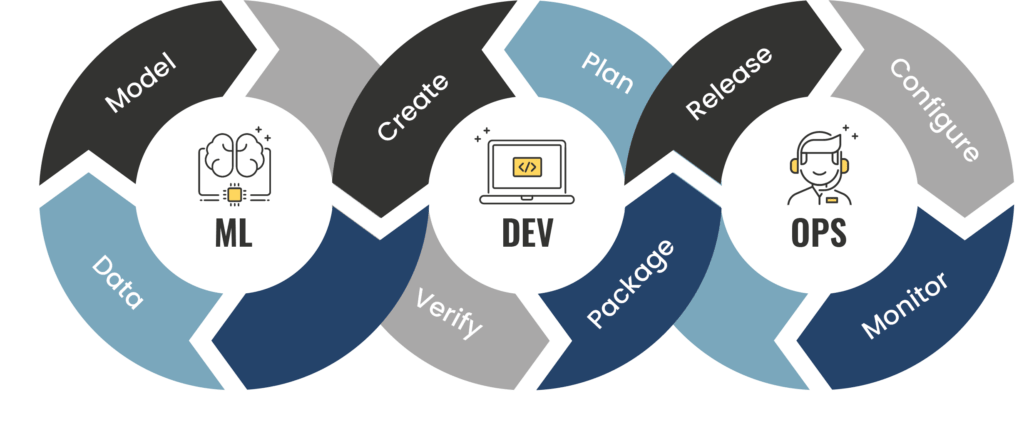
MLOps Challenges: Bridging Development and Operations in ML
MLOps (Machine Learning Operations) focuses on streamlining the end-to-end lifecycle of machine learning projects, from development to deployment and monitoring. Unlike traditional software development, ML systems are dynamic, requiring continuous updates to adapt to changing data and business requirements. This complexity introduces several challenges:

- Collaborative Complexity: The ML workflow involves diverse personas—data scientists, engineers, and business stakeholders—each with unique skill sets and tools. Aligning their efforts is critical but often difficult.
- Beyond Just Code: ML development encompasses more than writing code; it includes data acquisition, feature engineering, model evaluation, deployment pipelines, and monitoring.
- Dynamic Nature of ML Models: Models degrade over time due to data drift or changes in business needs, requiring constant retraining and validation.
- Operational Gaps: Key considerations like scalability, security, governance, explainability, and reproducibility are often overlooked during initial development phases.
- High Costs: Continuous monitoring, retraining, and infrastructure scaling can lead to significant operational expenses without proper automation.
- Lack of Collaboration Tools: Misalignment between teams can create bottlenecks in the ML lifecycle.
How AWS SageMaker Addresses MLOps Challenges
AWS SageMaker offers a comprehensive suite of tools designed specifically to address these challenges:
- SageMaker Pipelines: Automates the creation of end-to-end ML workflows with built-in CI/CD capabilities.
- SageMaker Model Monitor: Provides continuous monitoring for deployed models to detect data drift and performance degradation.
- SageMaker Feature Store: Centralizes feature storage for reuse across teams and projects.
- Elastic Scalability: Automatically scales infrastructure based on workload requirements.
- Integration with DevOps Tools: Supports containerization and CI/CD pipelines using AWS services like CodePipeline and CodeBuild.

A shared services environment in MLOps hosts common tools for pipeline management, execution, and repositories such as code repositories and model registries. AWS CodePipeline is used to orchestrate CI/CD workflows, integrating seamlessly with repositories like GitLab, GitHub, and Bitbucket. It sources files, triggers builds via AWS CodeBuild, and facilitates model training in SageMaker. Pipelines can be executed on-demand, via the CodePipeline console, or automatically upon code changes.
Organizations can define multiple pipelines based on their needs, such as:
- Container Build Pipeline – Creates container images for training, processing, and inference.
- Model Training Pipeline – Automates model training for release.
- Model Deployment Pipeline – Deploys trained models to production.
- Development & Testing Pipeline – Supports training and testing in the data science environment.
In practice, businesses may run multiple instances of the same pipeline concurrently, supporting different models, datasets, and configurations.
Key Components in the MLOps Architecture
- Code Repository: Central to MLOps, it stores code artifacts and serves as a trigger for CI/CD pipelines. Code commits (e.g., model training script changes) can automatically initiate relevant pipelines in development or production environments.
- Amazon Elastic Container Registry (ECR): A centralized container registry for data processing, model training, and inference. Tagged images help track lifecycle stages (e.g., development, production).
- SageMaker Model Registry: A central repository for managing models throughout their lifecycle, accessible across multiple projects.
- SageMaker Feature Store: A repository for reusable features, supporting offline model training and real-time inference across different environments.
This shared infrastructure ensures scalability, reusability, and automation, streamlining the MLOps lifecycle on AWS
Model Training Monitoring:
Effective model training monitoring provides visibility into training progress, helping identify bottlenecks and errors while enabling key operational processes like job tracking, performance evaluation, troubleshooting, and bias detection. Key aspects to monitor include:
- System Resource Utilization & Errors: Track CPU, GPU, memory, and disk I/O usage to optimize infrastructure provisioning for different training workloads.
- Training Job Status & Events: Monitor job initiation, progress, completion, and failures to ensure smooth execution.
- Model Training Metrics: Evaluate loss curves, accuracy trends, and other performance indicators to assess model quality.
- Bias Detection & Explainability: Detect potential biases in data or model predictions and analyze feature importance for better interpretability.
- Training Bottlenecks & Issues: Identify challenges such as vanishing gradients, poor weight initialization, or overfitting. Infrastructure-related inefficiencies like I/O bottlenecks, low GPU utilization, and load imbalances can also be addressed for optimal training performance.

This architecture enables comprehensive monitoring of model training, system metrics, event processing, and bias detection to support operational processes such as progress tracking, troubleshooting, and explainability.
AWS CloudWatch for Training Monitoring:
- Training & System Metrics: SageMaker emits training metrics (e.g., loss, accuracy) and system utilization metrics (CPU/GPU/memory) to AWS CloudWatch, which provides dashboards for visualization and analysis.
- CloudWatch Alarms: Automate notifications or responses for key events, such as low GPU utilization, by triggering alerts via AWS Simple Notification Service (SNS).
- CloudWatch Logs: Capture and analyze logs from training jobs to identify issues (e.g., GPU memory shortages or permission errors) using CloudWatch Logs Insights or by forwarding logs to Elasticsearch for further analysis.
Event-Driven Responses:
SageMaker training jobs generate status events (e.g., transitioning from running to complete). These events can trigger automated notifications for data scientists or responses such as model retraining upon failure.
Bias Detection & Explainability:
SageMaker Clarify detects bias in datasets and models while providing explainability insights. Reports are accessible via SageMaker Studio or APIs for better model transparency.
By leveraging these AWS services, organizations can enhance model reliability, automate responses, and optimize training infrastructure.
Model Endpoint Monitoring:
Monitoring model endpoints ensures visibility into serving infrastructure performance and model-specific metrics like data drift, model drift, and inference explainability. Key metrics include:
- System Utilization & Errors: Tracks CPU, GPU, and memory usage to optimize infrastructure provisioning for model serving.
- Data Drift: Detects shifts in data distribution over time that may impact model performance.
- Model Quality: Monitors performance deviations using regression (e.g., MAE, RMSE) and classification metrics (e.g., F1-score, precision, recall, accuracy).
- Inference Explainability: Analyzes feature importance for each prediction to improve transparency.
- Bias Monitoring: Identifies potential biases in real-time model predictions, similar to bias detection during training.

This architecture parallels the model training setup, using AWS CloudWatch for capturing endpoint metrics like CPU/GPU utilization, model invocation counts, errors, and latencies. These insights help optimize infrastructure and scale endpoints efficiently.
- Log & Event Monitoring: CloudWatch Logs capture model-serving logs for troubleshooting, while endpoint status changes (e.g., Creating to InService) enable automated notifications and corrective actions.
- Data & Model Monitoring: SageMaker Model Monitor and SageMaker Clarify track data drift and model quality:
- Data Drift Detection: Establishes a baseline from training data (mean, standard deviation, distribution) and compares production data for anomalies. Reports deviations and quality issues like missing values or incorrect data types.
- Model Quality Monitoring: Captures real-world predictions, merges them with ground-truth labels, and evaluates performance metrics (e.g., MAE for regression, accuracy for classification).

Both data drift and model quality metrics integrate with CloudWatch for visualization, alerting, and automated responses, ensuring models remain accurate and reliable in production.
Best practices for ML Platform Design & Operations:
Design & Implementation Best Practices:
- Leverage Managed Services: Use SageMaker’s built-in capabilities (algorithms, containers, feature stores) to simplify integration and reduce operational overhead. Opt for custom solutions only when necessary.
- Automate Infrastructure: Implement Infrastructure as Code (IaC) using CloudFormation or Terraform for consistent and automated ML infrastructure management.
- Build CI/CD Pipelines: Automate workflows with AWS CodePipeline, CodeBuild, and SageMaker for continuous integration and deployment. Consider GitHub Actions or Jenkins if needed.
- Track Experiments Automatically: Configure SageMaker or third-party tools to log training metadata (parameters, metrics, artifacts) for reproducibility and debugging.
- Centralize Model & Feature Storage: Use a central model repository for efficient discovery, collaboration, and compliance. Establish a feature store to streamline data reuse and governance.
- Design for Scalability & Security: Implement auto-scaling for variable workloads and enforce security best practices (encryption, access control, patching, incident response planning).
- Enable Self-Service: Develop governance-aligned self-service tools for users while maintaining operational control.
Operational Best Practices:
- Restrict Production Access: Limit access to production environments to essential personnel to prevent unauthorized changes.
- Optimize Costs: Utilize auto-scaling, spot instances, and availability-based pricing to control cloud expenses.
- Monitor & Observe: Use CloudWatch, SageMaker Debugger, and Model Monitor to track model performance, system health, and data drift.
- Establish Change & Incident Management: Implement structured change approval processes and an incident response plan to detect, escalate, and resolve issues.
- Ensure Resilience & Reliability: Deploy infrastructure across multiple availability zones (AZs) and regions to minimize latency and enhance availability.
- Plan Capacity & Resource Utilization: Assess infrastructure needs based on workloads and roadmaps, and apply tagging strategies for better visibility, security, and compliance.
References:
For more detailed information and advanced configurations, refer to the following resources: