
Perform Incident detection and response by scanning terabytes of log data and define alerts as code for a well managed cloud infrastructure.

StreamAlert
is a serverless, real-time data analysis framework which enables cloud ops and security team to scan terabytes of log data from any environment, using data sources and alerting logic you define for incident detection and response.
Incoming log data will be classified and processed by the rules engine. Alerts are then sent to one or more outputs.
Benefits:
- Serverless & Scalable
- Alert as code (rules are written in Python)
- Infrastructure as code (Terraform)
- Secure (TLS, KMS)
- Real-time alerting (when Kinesis Stream is used)
- Merge alerts to reduce noise
- Extensive data format support (JSON, CSV, KV pairs)
- Built-in support for dozens of log types and schemas
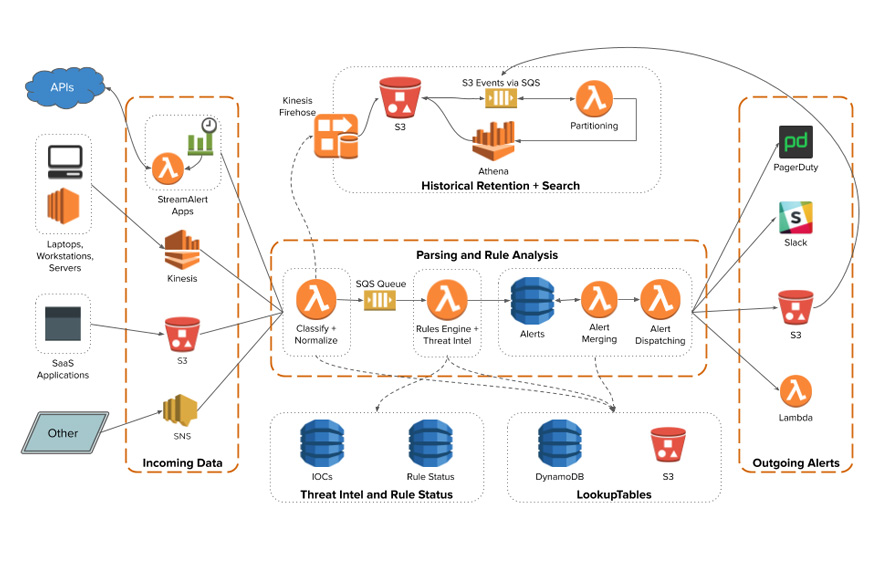
Serverless Architecture:
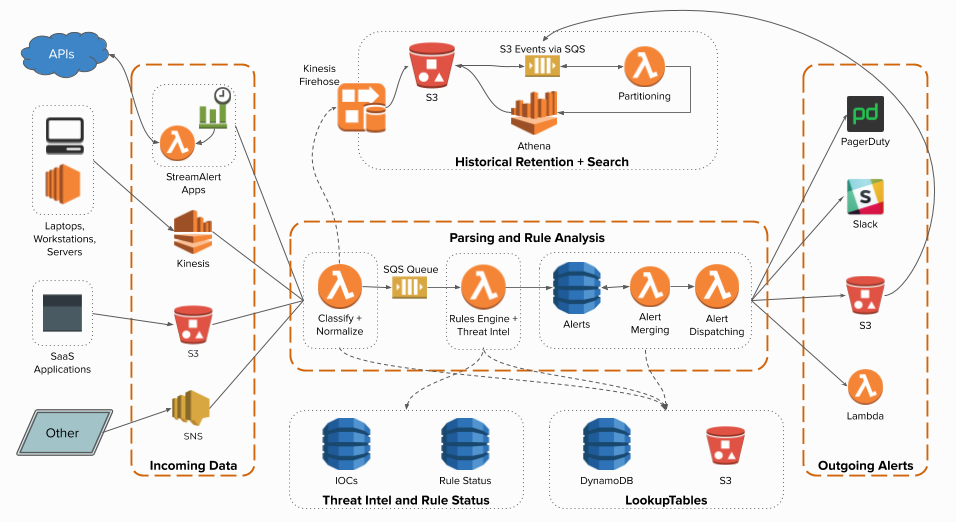
SteamAlert supports both near real-time alert and historical alert search
- Near real-time alert is processed with Kinesis Streams as log source and goes thru Parsing and Rule Analysis as specified in the middle section of the above architecture.
- The classifier Lambda function is also capable of sending the logs consumed from the Kinesis Streams to Kinesis Firehose and later transformed with Lambda so Athena can query them efficiently
Four parts:
StreamAlert at a high level contains 4 parts:
- Schemas to define the structure of logs (eg: attributes and data type)
- Clusters dedicated to specific log data processing (eg: cloudwatch, cloudtrail)
- Rules to create complex logic on when to trigger (eg: Root login)
- Outputs to send the alert to different destinations (eg: slack, PD, SNS)
Schemas:
Log schemas are required to detect the correct log type of an incoming record
- Defined in conf/schemas/<log-type>.json and used by rules in Python to determine which records are analyzed
- They can be defined in one single file or multiple files for each log type
- They represent the structure of a given log in <K,V> pairs
- Keys in a schema refers to name of a field referenced by rules
- Values in a schema refers to the data type of the field
- Clusters dedicated to specific log data processing (eg: cloudwatch, cloudtrail)
"cloudwatch:events": {
    "schema": {
      "account": "string",
      "detail": {},
      "detail-type": "string",
      "id": "string",
      "region": "string",
      "resources": [],
      "source": "string",
      "time": "string",
      "version": "string"
    },
    "parser": "json",
    "configuration": {
      "normalization": {
        "event_name": ["detail", "eventName"],
        "account": [
          {
            "path": [
              "account"
            ],
            "function": "Destination account ID"
          },
          {
            "path": [
              "detail",
              "userIdentity",
              "principalId"
            ],
            "function": "Source account ID"
          }
        ],
        "ip_address": [
          {
            "path": [
              "detail",
              "sourceIPAddress"
            ],
            "function": "Source IP addresses"
          }
        ],
        "user_agent": [
          "detail",
          "userAgent"
        ],
        "user_identity": [
          {
            "path": ["detail", "userIdentity", "type"],
            "function": "User identity type"
          },
          {
            "path": ["detail", "userIdentity", "arn"],
            "function": "User identity arn"
          },
          {
            "path": ["detail", "userIdentity", "userName"],
            "function": "User identity username"
          }
        ]
      }
    }
  }
Let’s understand this schema file:
- This schema is based on
cloudwatch:events - Contains few attributes such as account (string), detail (array), etc
- Uses json as parser to parse the literal and complex type attributes. Eg: event_name attribute is extracted from from detail array as [“detail”, “eventName”]
Clusters:
A StreamAlert set up can have multiple clusters to process different types of inbound data (cloudtrail, cloudwatch) or one for each environment or only one cluster to process all inbound data. Adding additional clusters can improve performance.
- Defined by its own JSON file in the conf/clusters directory. To add a new cluster, a similar JSON with different configuration should suffice
- A cluster definition typically contains cluster configuration and set of data sources specifying type of inbound data supported
- Each definition of data source with associated inbound source should be mapped to an existing Schema
- An optional Module section can be used to enable monitoring with CloudTrail
{
  "id": "centralized-logging-account",
  "classifier_config": {
    "enable_custom_metrics": true,
    "log_level": "info",
    "log_retention_days": 14,
    "memory": 128,
    "timeout": 60
  },
  "data_sources": {
    "kinesis": {
      "abc_corporate_streamalert": [
        "cloudwatch"
      ]
    },
    "s3": {
      "abc.ct.logs": [
        "cloudtrail",
        "vpcflow"
      ]
    }
  },
  "modules": {
    "cloudtrail": {
      "s3_settings": {
        "enable_events": true
      }
    }
  }
}
Let’s understand this cluster file:
- This cluster config contains configuration, data sources and modules
- A cluster’s classifier function knows what types of data it should parse based on defined data_sources within each cluster configuration file
- Each data source (kinesis, s3
)contains a mapping of specific resource names (Kinesis stream names, S3 bucket names, etc) along with a list of log types that should be expected from that source - Log schemas are defined in one or more files in the conf/schemas directory
- A Kinesis Stream “abc_corporate_streamalert” produces cloudwatch logs defined by cloudwatch Schema
- A S3 bucket “abc.ct.logs” produces cloudtrail and vpcflow logs defined by their respective Schema
- Finally, in-built modules section creates a new CloudTrail and an S3 bucket for the resulting logs generated by StreamAlert
Rules:
Rules are the interesting part of StreamAlert as it enables to write complex logic in Python to trigger alerts
- Rules are written in Python that contain data analysis and alerting logic
- A Rule can be run against multiple log sources or isolated into different environments via cluster configuration
- Rule alerts can be sent to one or more outputs like SNS, S3, PD, Slack, etc
@rule(
    logs=['cloudtrail:events', 'cloudwatch:events'],  # Rule applies to these 2 schemas
    merge_by_keys=['useragent'],  # Merge alerts with the same 'useragent' key-value pair
    merge_window_mins=5,  # Merge alerts every 5 minutes
    outputs=['pagerduty:csirt', 'slack:security']  # Send alerts to these 2 outputs
)
def cloudtrail_root_account_usage(record):
  """Page security team for any usage of AWS root account"""
  return (
      get_first_key(record, 'userIdentity', {}).get('type') == 'Root' and
      not get_first_key(record, 'invokedBy') and
      get_first_key(record, 'eventType') != 'AwsServiceEvent'
  )
Let’s understand this Rule python code:
- There is set of annotations specified on top of the function cloudtrail_root_account_usage
- The annotation refers to logs cloudtrail & cloudwatch defined by their respective Schema object
- These two logs merged by useragentkey that is common to both the log data
- The python function validates whether any Root user login attempted every 5 minutes and sends alert out to two outputs: PagerDuty & Slack
- The python function can implement complex logic before raising an alert
Outputs:
StreamAlert supports wide range of alerting framework and destinations that includes CloudWatch Logs, Kinesis Firehose, Lambda, S3, SNS, SES, SQS, GitHub, Jira, PagerDuty, Slack, MS Team, etc. Moreover, a new output can be created by inheriting StreamOutputBase class
Enrich with Lookup Tables:
Lookup Tables enable StreamAlert to hydrate & enrich alerting data as well as customize rule logic by pulling down data from external storage. StreamAlert supports S3 & DynamoDB for external data to be augmented
{
  "enabled": true,
  "tables": {
    "my-table-1": {
      "driver": "dynamodb",
      "table": "dynamodb-table-name",
      "partition_key": "partition-key",
      "value_key": "value-column",
      "cache_maximum_key_count": 3,
      "cache_refresh_minutes": 3,
      "consistent_read": false
    },
    "my-table-2": {
      "driver": "s3",
      "bucket": "s3-bucket-name",
      "key": "file.json",
      "compression": false,
      "cache_refresh_minutes": 10
    }
  }
}
Let’s understand this configuration file:
- enabled is a boolean to specify whether the lookup table is enabled or not
- It defined two lookup tables one each with S3 and DynamoDB that contains the lookup table
- LookupTables makes these storage solutions available to StreamAlert’s Lambda functions. It is available on all classifiers, the rules engine, the alert merger, and the alert processor.
- Usage:
from streamalert.shared.lookup_tables.core import LookupTables

value = LookupTables.get('my-table-1', 'my-key', 'default-value')
Alert as code architecture:
We have adopted StreamAlert and implemented for centralized logging architecture that does near real-time alerting to various output destinations

What Next?
Watch out for our next installment of X-as-code and how Info Services have implemented them in our client solutions
Author: Raghavan Madabusi